
Health Checks in C#: Implementing Robust Application Monitoring
Ensure your .NET applications stay healthy, responsive, and production-ready. Learn how to implement health checks with SQL Server integration and dashboard visualization.

Health checks are essential components of modern applications that help monitor system status, dependencies, and overall application health. In C#, health checks provide a standardized way to verify that your application is functioning correctly and its dependencies are available.
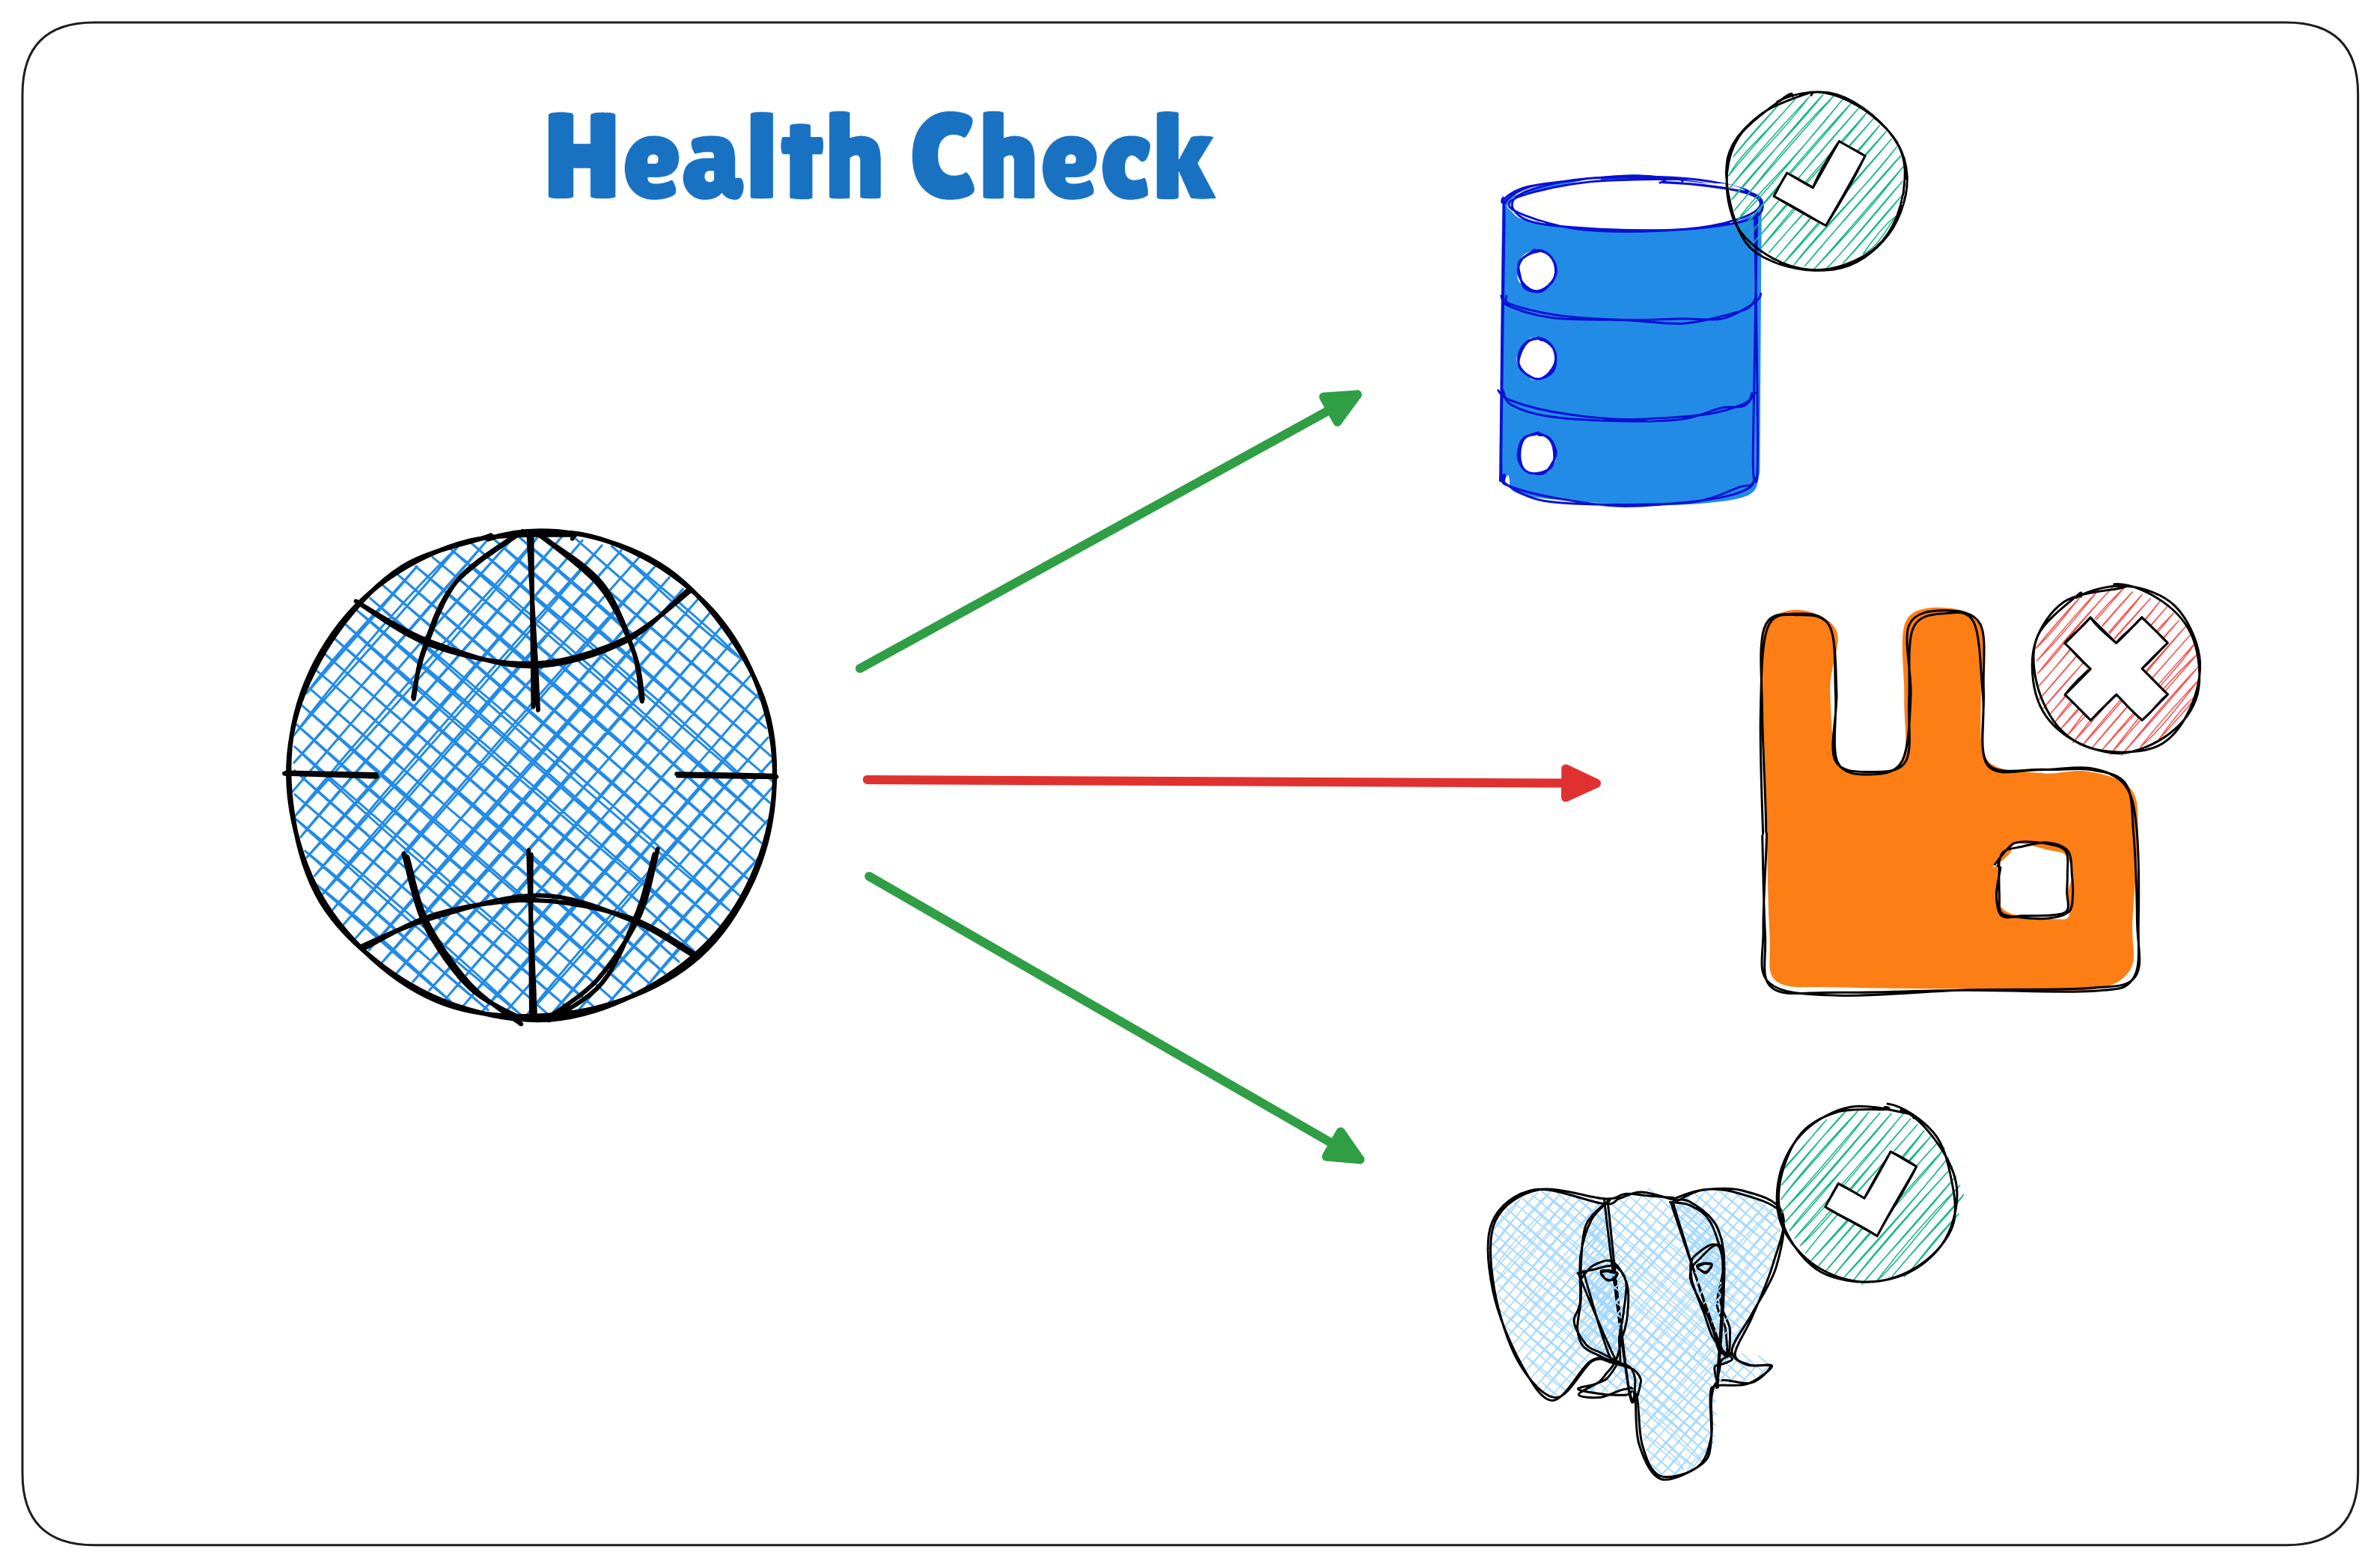
Health Checks are not binary. What if our application is responding, but slower than expected? ASP.NET Core provides us with three different Health Check levels:
Healthy – our application is healthy and in a normal, working state.
Unhealthy – our application is unhealthy and is offline or an unhandled exception was thrown while executing the check.
Degraded – our application is still running, but not responding within an expected timeframe.
Why Implement Health Checks?
Monitoring: Quickly identify when parts of your system fail
Load balancing: Help orchestrators make routing decisions
Self-healing: Enable automatic recovery scenarios
Operational visibility: Provide insights into system health
⚡ Why Health Checks Matter
Imagine this:
Your API is live. Users are happy. But one day, the database crashes — and no one notices until customer complaints start rolling in.
With health checks:
You can detect issues early
Integrate with monitoring tools (like Grafana, Prometheus, Azure Monitor, etc.)
Create a feedback loop to recover fast
Improve service reliability
Types of Health Checks in C# Applications
Modern applications often depend on multiple services and resources to function properly. Health checks help monitor these critical dependencies, and we can categorize them into several types:
1. Basic Availability Probes
These are the simplest form of health checks, typically implemented as HTTP endpoints that return a status indicating whether the application is running. They provide a quick way to verify the application's basic availability without deep dependency checks.
2. System Resource Monitors
These checks examine the underlying infrastructure hosting the application, including:
Available disk space
Memory utilization
CPU usage
Network connectivity
They help identify potential resource constraints before they cause application failures.
3. Database Connectivity Checks
These specialized probes verify connectivity and responsiveness of data storage systems, supporting various database technologies:
SQL Server
PostgreSQL
CosmosDB
Redis
And other common database providers
4. Custom Dependency Verifications
For application-specific requirements, developers can implement tailored checks for:
Third-party API availability
External service dependencies
Logging system capacity
Specialized hardware connections
Business logic validations
These checks require custom implementation to address unique application needs.
Each type serves a distinct purpose in maintaining application reliability and providing operational visibility. The combination of these checks gives a comprehensive view of the application's health status.
Basic Health Check Implementation
1. Installation
You can install Refit via NuGet Package Manager:
dotnet add package AspNetCore.HealthChecks.UI
dotnet add package AspNetCore.HealthChecks.Client
2. Setting Up Health Checks in ASP.NET Core
// In Startup.cs or Program.cs
var builder = WebApplication.CreateBuilder(args);

// Add basic health check service
builder.Services.AddHealthChecks();

var app = builder.Build();

// Map health check endpoint
app.MapHealthChecks("/health");

app.Run();
3. Creating Custom Health Checks
public class RemoteHealthCheck : IHealthCheck
{
    private readonly IHttpClientFactory _httpClientFactory;
    public RemoteHealthCheck(IHttpClientFactory httpClientFactory)
    {
        _httpClientFactory = httpClientFactory;
    }
    public async Task<HealthCheckResult> CheckHealthAsync(HealthCheckContext context, CancellationToken cancellationToken = new CancellationToken())
    {
        using (var httpClient = _httpClientFactory.CreateClient())
        {
            var response = await httpClient.GetAsync("https://api.ipify.org");
            if (response.IsSuccessStatusCode)
            {
                return HealthCheckResult.Healthy($"Remote endpoints is healthy.");
            }

            return HealthCheckResult.Unhealthy("Remote endpoint is unhealthy");
        }
    }
}

// Register the custom health check
builder.Services.AddHealthChecks()
    .AddCheck<RemoteHealthCheck>("Remote endpoints Health Check", failureStatus: HealthStatus.Unhealthy);
Advanced Health Check Scenarios
1. Database Health Check
builder.Services.AddHealthChecks()
    .AddSqlServer(
        connectionString: builder.Configuration.GetConnectionString("DefaultConnection"),
        healthQuery: "SELECT 1;",
        name: "sqlserver",
        failureStatus: HealthStatus.Unhealthy,
        tags: new[] { "db", "sql" });
2. External Service Health Check
builder.Services.AddHttpClient();
builder.Services.AddHealthChecks()
    .AddUrlGroup(
        new Uri("https://api.example.com/health"),
        name: "external_api",
        failureStatus: HealthStatus.Degraded);
3. Disk Storage Health Check
builder.Services.AddHealthChecks()
    .AddDiskStorageHealthCheck(s =>
        s.AddDrive("C:\\", 1024), // 1 GB minimum free space
        name: "disk",
        failureStatus: HealthStatus.Degraded);
Running our application and navigating to /health, we will see our database Health Check returning a Healthy status.
Configuring Health Check UI
For better visualization:
// Here is the GUI setup and history storage
builder.Services.AddHealthChecksUI(options =>
{
//Sets the time interval in which HealthCheck will be triggered
options.SetEvaluationTimeInSeconds(5);
//Sets the maximum number of records displayed in history
options.MaximumHistoryEntriesPerEndpoint(10);
//Sets the Health Check endpoint
options.AddHealthCheckEndpoint("Health Checks API", "/health");
}).AddInMemoryStorage(); //Here is the memory bank configuration
// Configure endpoints
app.MapHealthChecks("/health", new HealthCheckOptions
{
Predicate = _ => true,
ResponseWriter = UIResponseWriter.WriteHealthCheckUIResponse
});
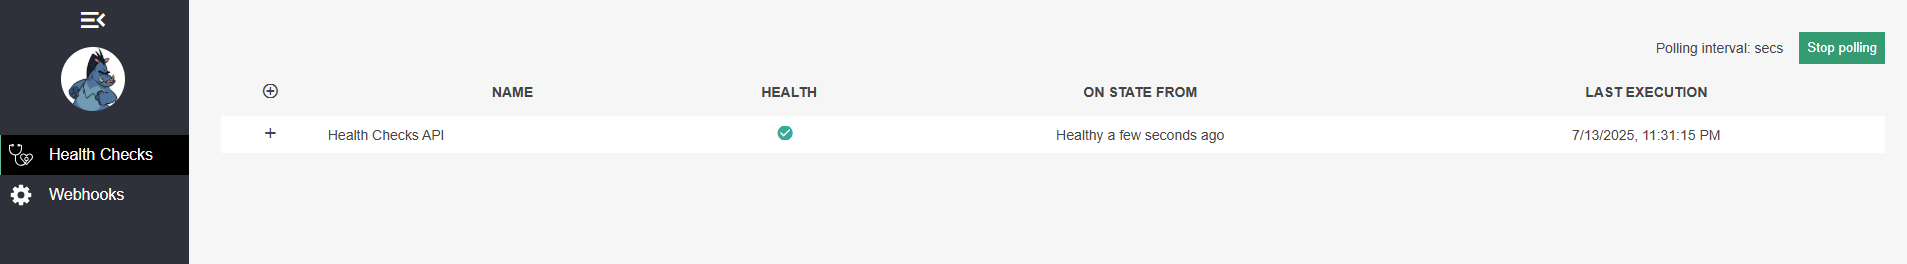
app.UseHealthChecksUI(options => { options.UIPath = "/dashboard"; });Now if we navigate to /dashboard, we should see a much more friendly interface:
Best Practices
Categorize checks: Use tags like "ready", "live", or "startup"
Set appropriate timeouts: Prevent health checks from taking too long
Secure endpoints: Protect health check endpoints in production
Monitor dependencies: Check all critical external services
Provide meaningful responses: Include relevant diagnostic information
Leveraging Existing Health Check Libraries
Before building custom health checks from scratch, developers should explore the rich ecosystem of pre-built health check packages available for .NET. The AspNetCore.Diagnostics.HealthChecks repository offers a comprehensive collection of health check implementations for popular services and technologies.
Popular Pre-Built Health Check Packages
The ecosystem includes specialized health checks for:
Databases:
SQL Server (
AspNetCore.HealthChecks.SqlServer)PostgreSQL (
AspNetCore.HealthChecks.Npgsql)MongoDB (
AspNetCore.HealthChecks.MongoDB)
Message Brokers:
RabbitMQ (
AspNetCore.HealthChecks.RabbitMQ)Kafka (
AspNetCore.HealthChecks.Kafka)
Cloud Services:
AWS S3 (
AspNetCore.HealthChecks.Aws.S3)Azure Service Bus (
AspNetCore.HealthChecks.AzureServiceBus)
Real-time Communication:
SignalR (
AspNetCore.HealthChecks.SignalR)
Caching Systems:
Redis (
AspNetCore.HealthChecks.Redis)Memcached (
AspNetCore.HealthChecks.Memcached)
Implementation Example
Here's how to integrate health checks for PostgreSQL and RabbitMQ in your application:
builder.Services.AddHealthChecks()
    .AddCheck<CustomSqlHealthCheck>("custom-sql", HealthStatus.Unhealthy)
    .AddNpgSql(
        connectionString: pgConnectionString,
        name: "postgresql",
        failureStatus: HealthStatus.Degraded,
        tags: new[] { "db", "postgres" })
    .AddRabbitMQ(
        rabbitMQConnectionString: rabbitConnectionString,
        name: "rabbitmq",
        failureStatus: HealthStatus.Unhealthy,
        tags: new[] { "messaging", "queue" });
Benefits of Using Existing Libraries
Time-saving: Eliminates the need to write boilerplate health check code
Reliability: Uses community-tested implementations
Consistency: Follows standard patterns for health monitoring
Detailed reporting: Often includes diagnostic information beyond simple status
Configuration options: Typically support custom timeouts and status thresholds
When to Consider Custom Implementations
While the existing libraries cover many common scenarios, custom health checks may still be necessary for:
Proprietary systems
Unique business logic requirements
Specialized hardware integrations
Complex composite health scenarios
Developers should balance between leveraging existing solutions and creating custom checks where truly needed.
🚀 Bonus Tips
💡 Add more checks: Redis, RabbitMQ, Disk space, etc.
🔐 Secure your health endpoint in production using authentication or IP filtering.
📊 Integrate with dashboards (Grafana, Prometheus, Azure Monitor).
🔔 Set alerts for
Unhealthystatus via email, Slack, PagerDuty, etc.
🧵 Wrapping Up
Health checks are simple to add but powerful in impact.
They help you catch issues proactively, improve observability, and boost confidence in your infrastructure.
Don’t wait for users to tell you something’s wrong. Let your app tell you first.
📁 GitHub Example
👉 Full working code available at:
🔗 https://sourcecode.kanaiyakatarmal.com/HealthChecks
I hope you found this guide helpful and informative.
Thanks for reading!
If you enjoyed this article, feel free to share it and follow me for more practical, developer-friendly content like this.